Working with History
Geogig is a specialized database that was designed for distributed editing and supports collaborative editing of geospatial data. It is designed for vector data (point, line, polygon, etc.). When a layer has been stored in Geogig, it maintains the history of all of the changes made to the data along with who made the changes and when. Within the web map, you can view the history for a layer and for the features.
History tab in Geoshape
Geogig layers in Geoshape will have a Geogig tab in addition to the other tabs on the Layer detail page. This shows a history of commits that have been made to the layer.
In the Layer detail page, click on the Geogig tab to see the chronological list of commits.
Layer Geogig tab in Geoshape
View layer history
You can also view the history of a layer stored in Geogig when the layer has been added to a map.
Click on the name of the layer you want to view. The menu will expand to show additional layer options.
Click on the Show History button. The history will expand at the bottom.
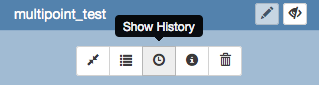
Show History Button for Layers
To view details about a commit, hover the mouse over it. The bar next to the commit indicates the type of edits that were made. Green indicates a new feature was added. Yellow indicates a feature was modified. Red indicates a feature was deleted. A commit can have multiple types of edits. In such a case, the bar will have colors proportional to the types of edits that were made.
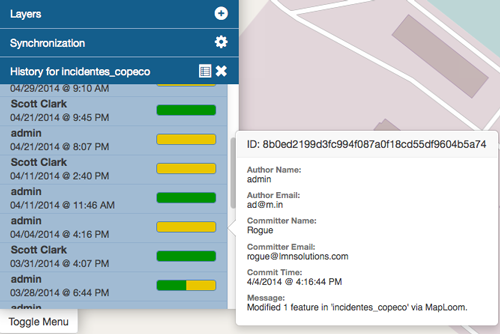
History detail for a commit
Click on the commit and the history will update to show the individual edits within that commit. MapLoom will make one commit per edit. The Arbiter mobile app can upload many edits as one commit.
List of edits in a commit
Clicking on an edit will bring up a new window that shows the specific changes that were made. The changes will be highlighted with the same color coding as the commits. Green means something was added, yellow means it was changed, and red means it was deleted. In the image below, the feature was moved, and so the point on the map is highlighted in yellow.
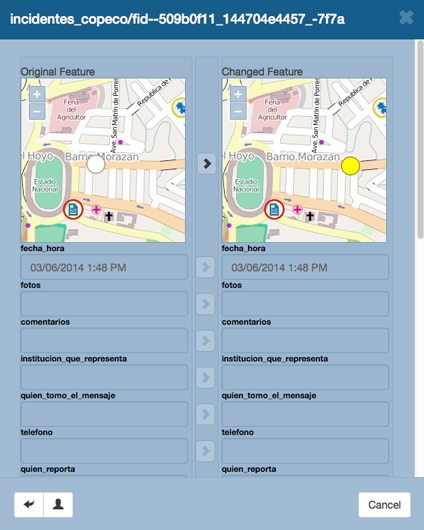
Detailed view of changes
View feature history
In addition to viewing the history of edits on a Geogig layer, you can also view the history of a feature.
Click on the feature on the map. The feature details will appear.
Click on the Show History button. The history list will expand with the commits that contain changes for that feature.
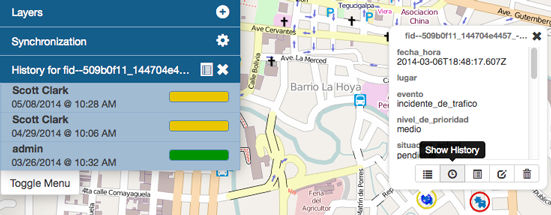
Show History for a feature
Click on the specific commit you want to view details for. The history will update to show the edits made to the feature for that commit.
List of edits in a commit
Clicking on the edit in the list will bring up a new window that shows the specific changes that were made. The changes will be highlighted with the same color coding as the commits. Green means something was added, yellow means it was changed, and red means it was deleted. In the image below, the feature was moved, and so the point on the map is highlighted in yellow.
Detailed view of changes
Click on the Show Authors button to see the names and dates for every attribute in the feature. Note that through the lifetime of a feature, there can be several authors. This is a good way to see who has contributed to a feature’s current state.
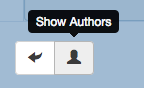
The Show Authors button
Summarize history
You can visualize a summary of all of the edits within a date range for a layer.
Click on the Show History button for layer that you want to summarize.
Show History Button for Layers
Click on the History Summary button.
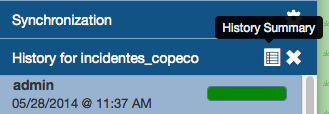
History Summary button
Enter the date range for the history to summarize
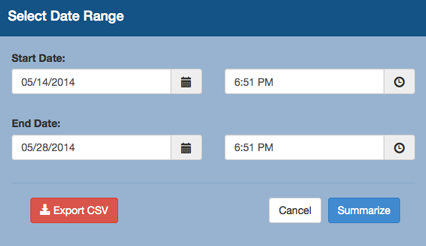
Select the Date Range
Click on the Summarize button
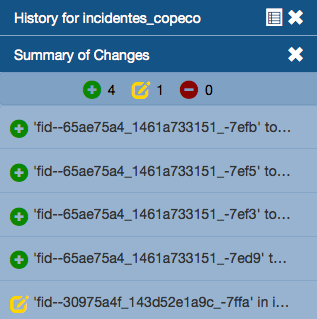
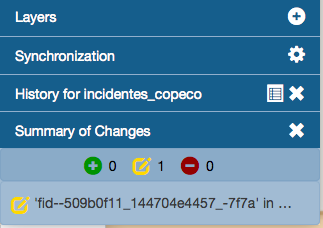
Summary of changes for the selected date range
Click on one of the edits in the list to see a detailed view
Export history
You can export a summary of all of the edits within a date range for a layer.
Click on the Show History button for layer that you want to summarize.
Show History Button for Layers
Click on the History Summary button.
History Summary button
Enter the date range for the history to summarize
Select the Date Range
Click on the Export CSV button
When you are prompted to save the file, browse to the location where you want to save it to your computer and click Ok